TaraPrep Mock Score Estimator: Converter and Method
Use TaraPrep's mock score estimator and see how it maps raw marks onto an estimated TARA-style scale using published score distributions.
Convert your raw mark
Use this first. Choose Critical Thinking or Problem Solving, then enter your score out of 22.
Convert your raw mark out of 22
Choose Critical Thinking or Problem Solving, enter a raw mark, and get the current TaraPrep estimate on the 1.0 to 9.0 reporting scale.
Section
Raw score
14/22
Critical Thinking
Estimated score
4.4
TARA-style 1.0 to 9.0 scale
Estimated percentile
55th
From TaraPrep's provisional reference model
The number above is an Estimated TARA-style score, not an official TARA result. Official scores are produced by UAT-UK using the live candidate cohort and the official scoring process. TaraPrep uses the published score distributions to make mock scores easier to interpret.
For the official scale, percentile anchors, results and the meaning of a good score, read the separate TARA scoring guide. This page is specifically about TaraPrep's practice-score estimator and its assumptions.
The short version
TaraPrep estimates a score in three steps.
First, we start with the raw mark from a 22-question Critical Thinking or Problem Solving module.
Second, we estimate where that raw mark would sit in a provisional reference distribution for a 22-question reasoning test. This is a modelling assumption, not an observed TARA candidate percentile, because UAT-UK does not publish the raw-mark distribution.
Third, we map that estimated percentile onto the published 2025/26 TARA score distribution. That gives a score estimate on the familiar 1.0 to 9.0 scale.
The visual model
The left chart below shows the published score distribution we extracted from the official results PDF. The right chart shows how each raw mark from 0 out of 22 to 22 out of 22 maps onto the estimated 1.0 to 9.0 score scale.
Distribution on the left, conversion curve on the right
Critical Thinking published score distribution
Click a score bin to choose the nearest raw-mark estimate.
Click a score bin to select the nearest raw mark estimate.
Raw mark to estimated score
Click any raw mark bar to update the estimate.
Clickable raw marks from 0 to 22, mapped onto the extracted score distribution.
Selected raw mark
14/22
Estimated score
4.4
Estimated percentile
55th
This is the key idea: the raw mark does not become a score by simple percentage. The model estimates its percentile within the provisional reference distribution, then maps that percentile onto the published TARA score distribution.
Why raw marks need context
A score like 14 out of 22 is honest, but it is hard to interpret on its own. It might feel strong because it is above half marks. It might feel weak because eight questions were missed. Neither instinct tells you where the mark sits in the TARA score distribution. The TARA test format explains why each scored module uses a 22-question paper.
The real TARA result is reported on a 1.0 to 9.0 scale, to one decimal place. The official explanation of results says typical candidates score around 4.5, with only about 10% scoring higher than 7.0. That is why the estimate is shown as both a scaled score and an approximate percentile.
What the official PDF gives us
The official TARA Explanation of Results PDF does not publish a raw-mark-to-score table. It does provide score distribution charts for Critical Thinking and Problem Solving.
For each module, the chart gives the percentage of candidates in score bins from 1.0 to 9.0. The bins are spaced by half-points: 1.0, 1.5, 2.0, 2.5, and so on up to 9.0.
Those charts are enough to reconstruct the shape of the reported score distribution. They are not enough, by themselves, to reconstruct the official raw-mark conversion. That distinction is why TaraPrep labels the output as an estimate.
How we extracted the charts
The official TARA Explanation of Results PDF stores the two distribution charts as embedded images. That lets us work from the image data directly instead of reading bar heights by eye.
The extraction script:
- extracts the embedded chart images from the PDF
- detects the x-axis baseline and the top of the y-axis
- finds the orange bar shapes
- measures each bar height in pixels
- converts pixel height into percentage points using the chart's 0% to 14% y-axis
- normalises the measured bins so the distribution sums to 100%
The measured chart totals are within 0.2% of 100%
Critical Thinking raw extracted total
100.1044%
Normalised to 100.0000%
Problem Solving raw extracted total
100.1628%
Normalised to 100.0000%
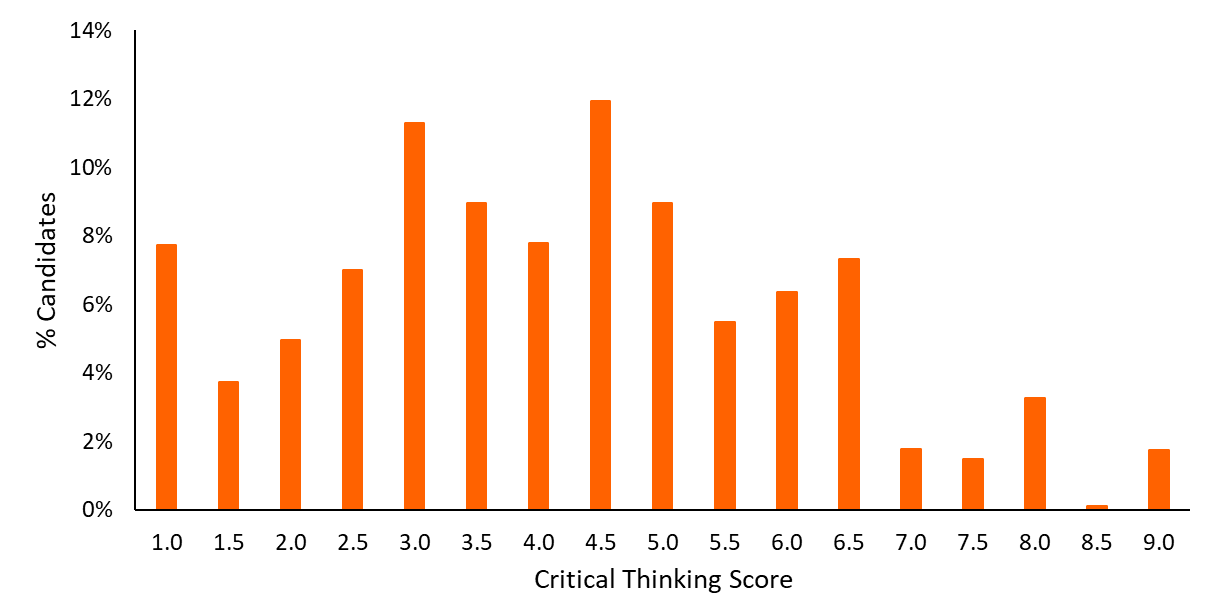
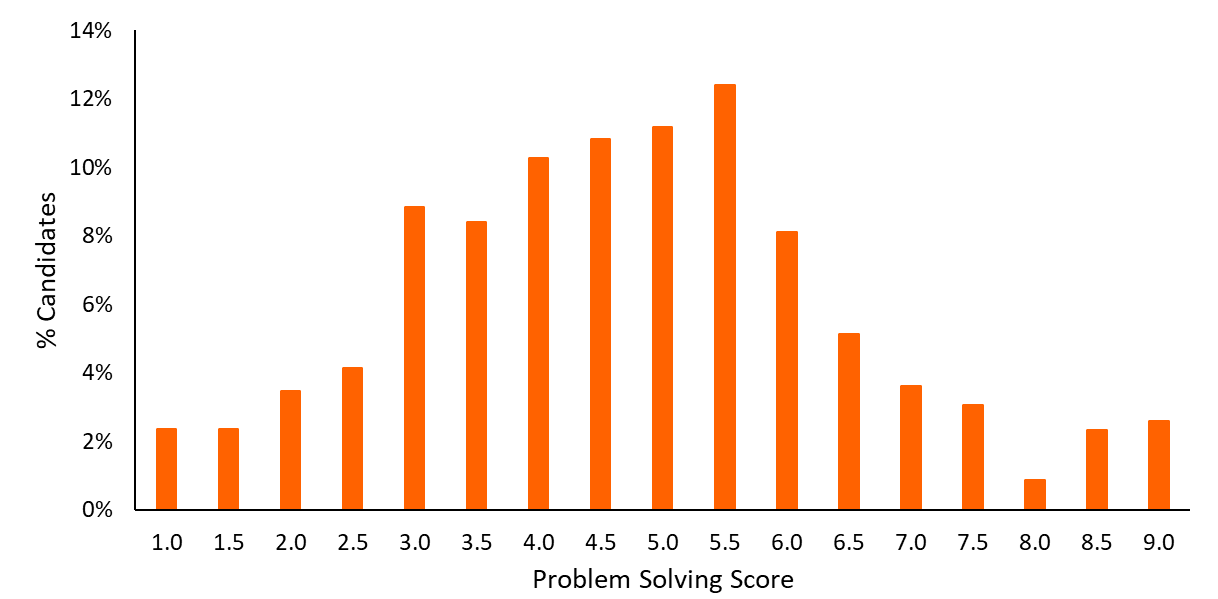
The raw totals are deliberately shown because they are a sanity check. If the script missed a bar, included axis text, or used the wrong scale, the totals would not land so close to 100%.
From score to the published distribution
Once we have the extracted distribution, a reported score can be located approximately within that published candidate distribution.
For a Problem Solving score around 6.0, we add the candidate percentages in the lower score bins, then interpolate within the 6.0 bin. The result is an estimated position in the published score distribution.
This is what turns a scaled score into a statement about relative performance.
From raw mark to score estimate
The official PDF does not tell us how many questions candidates answered correctly for each reported score. TaraPrep therefore uses a transparent provisional model.
The raw mark is located in a provisional reference distribution, then mapped onto the extracted official score distribution. Unlike a linear plotting position, the reference model does not assume that every raw mark from 0 to 22 is equally common.
The current reference model assumes an average of 13.2 correct answers out of 22 and reliability of 0.70. These are transparent interim assumptions informed by the structure of the test and historical evidence from similar thinking-skills admissions tests. They are not official TARA statistics.
For each possible mark, the model estimates the percentage of the reference cohort scoring below it, plus half of the candidates receiving that exact mark. This is known as a discrete mid-rank percentile:
estimated percentile = percentage scoring lower + half the percentage receiving the same mark
For example, the provisional model places 11 out of 22 around the 29th percentile, 14 out of 22 around the 55th percentile, and 17 out of 22 around the 81st percentile. A perfect mark is placed very near, but not at, the 100th percentile.
The model is versioned so these assumptions can be replaced when stronger calibration evidence becomes available.
Why CT and PS differ
Critical Thinking and Problem Solving use different published distributions. That means the same raw mark can map to a different estimated score depending on the module.
The converter preserves that difference instead of using one generic percentage scale for both modules.
Why this is not an official score
UAT-UK controls the official scoring process. It says live response data is analysed using a Rasch item response theory model and that different test forms are equated for difficulty. TaraPrep does not have the official item parameters or candidate response data needed to reproduce that process.
The public PDF gives reported score distributions, not raw marks. Our provisional reference distribution is therefore an approximation, not a reconstruction of the official raw-mark conversion.
So the output is labelled Estimated TARA-style score. It is useful for preparation, but it is not an official result.
How the model stays current
TaraPrep actively monitors the official ESAT-TMUA / UAT-UK website for new TARA results guidance and score-distribution data.
When new official data is published, we recalibrate the estimate model so the converter stays anchored to the best available public evidence.
How to interpret the estimate
Use the estimated score as a preparation guide, not as a prediction guarantee.
A score around 4.5 is close to the typical candidate area described by the official explanation. Scores above 7.0 sit in the upper part of the published distribution. Lower scores are not a verdict; they are a signal that accuracy, timing or a specific question type needs work.
The most useful next step is question review. A student who scores 5.3 because they ran out of time needs a different plan from a student who scores 5.3 because they repeatedly missed assumptions questions or multi-step Problem Solving procedures. The TARA preparation guide explains how to turn those different error patterns into a study plan.
Sources
- UAT-UK test results and scoring method
- UAT-UK TARA Explanation of Results: October 2025 and January 2026
- Cambridge Assessment: Thinking Skills and Admissions — validity and reliability report
Frequently asked questions
Is the converter official?
No. It is a TaraPrep estimate. It uses the published 2025/26 TARA score distributions, but the official raw-mark conversion is not public.
Why use percentiles at all?
Because the official scale is anchored to candidate performance. The provisional reference model provides a transparent bridge between a mock raw mark and the published distribution, but it is not a measured TARA raw-mark percentile.
Will every TaraPrep paper use the same boundaries?
The converter currently applies the same provisional raw-score reference distribution to every 22-question paper. Critical Thinking and Problem Solving are then mapped onto their separate published score distributions. We may introduce paper-level difficulty adjustments when there is enough evidence to support them.
Does full marks guarantee an official 9.0?
No. The current estimate rounds full marks to 9.0, but that remains a TaraPrep estimate rather than a guaranteed official result. The provisional model places full marks near, but not at, the 100th percentile using a discrete mid-rank.
Can the estimates change?
Yes. TaraPrep monitors the official ESAT-TMUA / UAT-UK website and recalibrates the model when new public results data becomes available.
Similar articles
TARA Scoring Explained: What Is a Good TARA Score?
How official TARA scoring works, what the 1.0 to 9.0 scale means, what counts as a good TARA score and how universities receive results.
TARA Critical Thinking: Complete Interactive Guide
A complete interactive guide to TARA Critical Thinking, including the format, all seven official question types, worked examples, timing and review methods.
TARA Problem Solving: What Maths Do You Need?
The exact maths knowledge required for TARA Problem Solving, explained clearly with the topics candidates should know and what is not required.